AHS SACE Stage 1 Physics
Home
The Basics
SI Units
Scientific Notation
Prefixes
Significant Figures
Variables
Manipulating Equations
Proportionalities
Rearranging Equations
Right Angled Trigonometry
Recording Data
Tables
Manipulating Data in Excel
Graphing
Graphing in Excel
Analysing Data
Calculating slope
Trends and Relationships
Precision vs Accuracy
Random Error
Systematic Error
Glossary
Finding the slope of a line by hand is a basic skill that you will use across all sciences. Watch the video for a quick review of this skill.
Choosing Points
When choosing points from your graph to calculate the slope, remember:
use the origin if the line of best fit passes through it
choose points that are easy to read accurately (where the line of best fit crosses major grid lines)
you
do not
have to choose plotted points from your data table
choose points that are fairly far apart on your graph
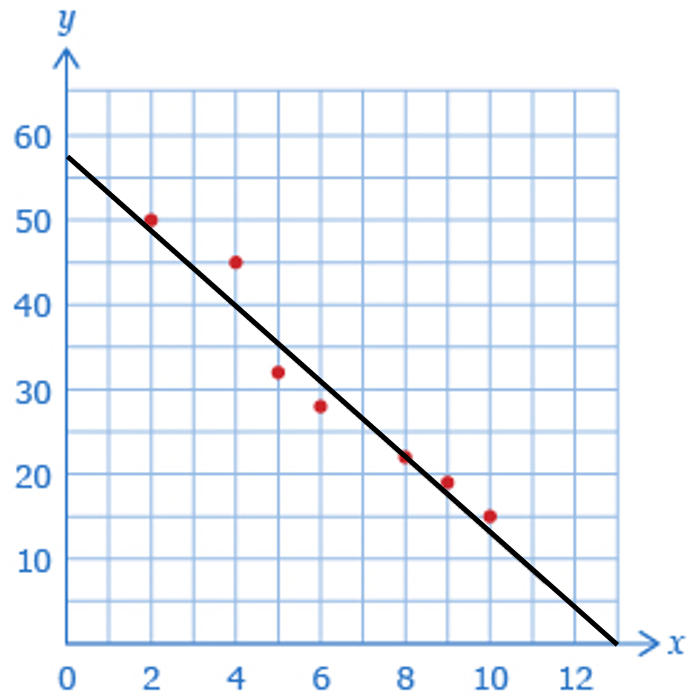
Good points to use from this graph would be (4, 40) and (13, 0). The only suitable data point for the slope would be (8, 22).
Slope Units
The units for the slope of a graph are simply
Watch the video on the right to practice finding the units of the slope.
Practice
Khan Academy