Designing the layout
When conducting an experiment, you should create a table to record results before collecting data. In a practical report, put a caption above the table e.g. Table 1:The intensity of light at varying distances from the light source.
In most cases
The title/caption should be "the effect of independent variable on dependent variable".
e.g. the effect of height on the drop time of a parachute.
In most cases
- the independent variable (that which you purposefully change) is in the left column
- the dependent variable (that which you measure) with the different trials are in the next columns
- the derived or calculated column (often the average) is on the far right.
The title/caption should be "the effect of independent variable on dependent variable".
e.g. the effect of height on the drop time of a parachute.
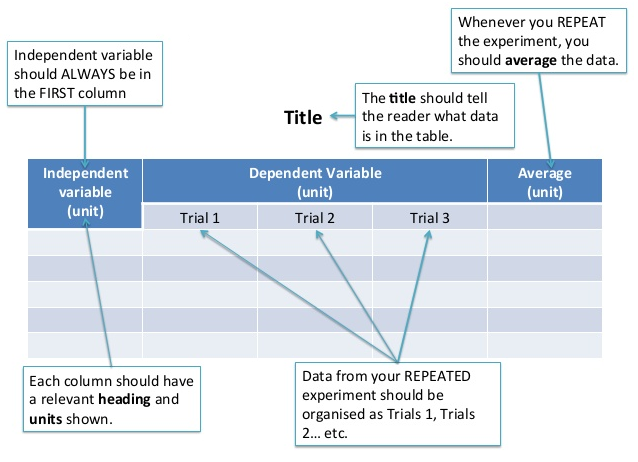
Table 1: A general template for a data table
Note: if you calculate a quantity based on the independent variable (for graphing purposes), put this column directly to the right of it.
Recording measurements to correct s.f.
Make sure to record data to the correct number of significant figures. Significant figures are the certain and uncertain digits recorded in a measurement.
- When using a digital reading, the uncertain value is the last digit.
- When using a standard scale, the certain values are read directly from the markings on the measuring instrument. The last figure of the measurement is uncertain and is estimated from between the last two markings.
Example
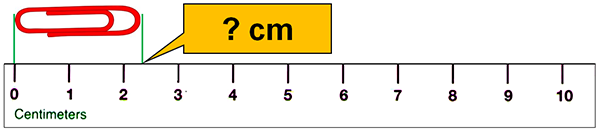
The ruler above is marked every centimeter so we know the ones place and could record 2. But we must also estimate one additional digit. So in this case we might record 2.3 cm or perhaps 2.4 cm. Either would be correct as the 2 is certain while the final digit is uncertain (it is estimated).
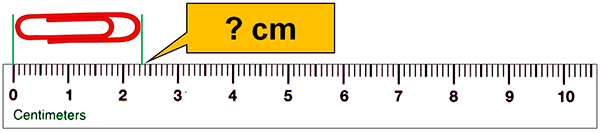
In this case, the ruler is marked in both ones and tenths meaning that we can clearly see the first part of the measurement is 2.3. However, we must again estimate one additional digit or place – 2.35 cm.
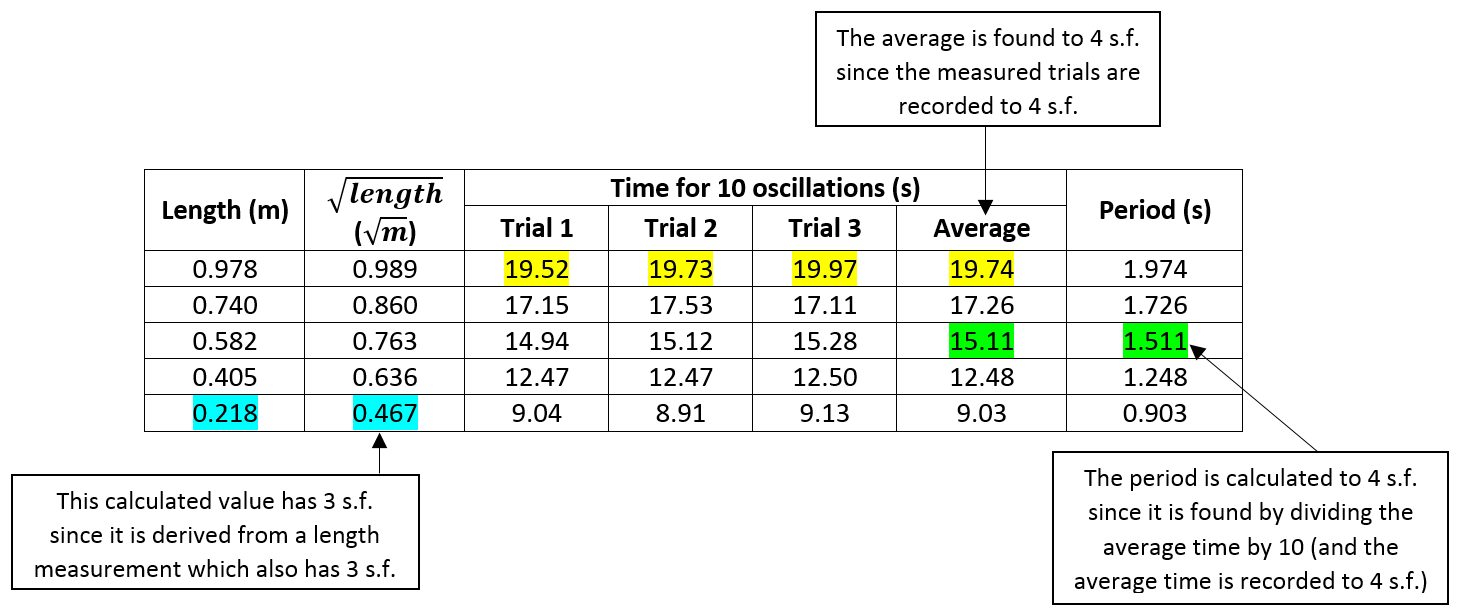
Calculated values in tables
When calculating derived values or averages, make sure to follow the rules of significant figures.
Example
Practice
Answer sections A to D in Measurement and Uncertainty tutorial below.
